The VP of Sales asks a business analyst to include a KPI object on the sales dashboard that shows total sales value for the year 2022, regardless of selections. Existing fields in the data model include Sales and Year.
How should the business analyst write the measure for the KPI object?
A business analyst needs to create a visualization that compares two measures over time using a continuous scale that includes a range. The measures will be Profit and Revenue.
Which visualization should the business analyst use?
Refer to the exhibit.
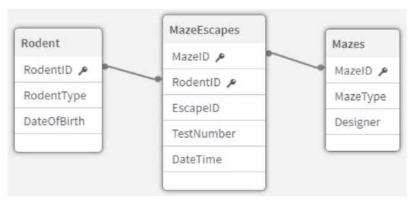
An app that will track experiments for rodents (e.g., rats and mice) that navigate mazes (labyrinths) is being developed. Individual rodents are catalogued in the Rodent table, while the Mazes table has metadata for the mazes. The MazeEscapes table holds a record of each attempt at a maze by a rodent. A business analyst needs to build a KPI that will allow users to see how many rodents have made at least one attempt at any maze.
How should the analyst construct the KPI?
* Use Count (Distinct RodentlD Counter) as the KPI expression.
* Use Sum (RodentlD Counter) as the KPI expression.
Use Sum (RodentlD Counter) as the KPI expression.
* Use Count (Distinct RodentID Counter) as the KPI expression.
The VP of Finance is requesting a presentable solution that allows them to share finance information in monthly meetings with C-suite executives. Given the monthly meeting agendas, the solution must be customizable.
Which Qlik Sense feature should be implemented to meet this requirement?
A business analyst is creating an app for the sales team. The app must meet several requirements:
* Compare 10 top-performing sales representatives and the amount of sales for each
* Investigate margin percentage and total sales by each product category
* View distribution of sales amount
Which visualizations should be used for this app?